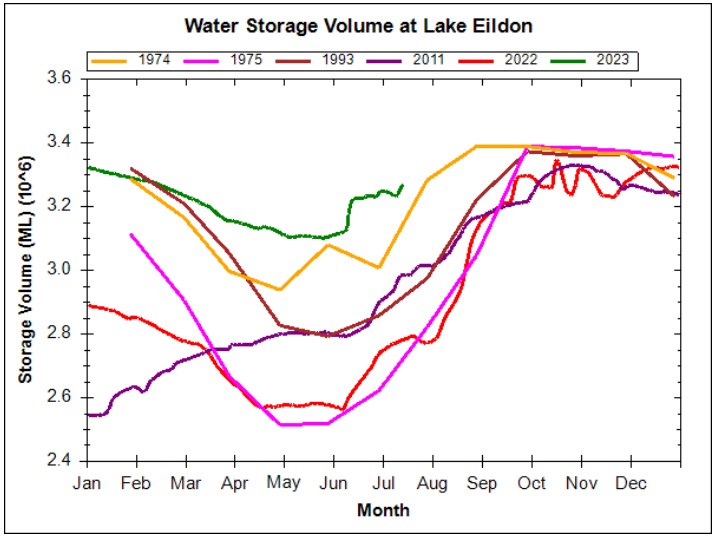
First of all, let me say that I don’t know a thing about water management, but after checking the historic water levels back to 1962, I’ve got to say I’m more than perplexed.
Looking at the graph above it can clearly be seen that this years current level far exceeds the other high water level for July going back to 1962. The Eildon target filling point for July 2023 was 93.4%, the current level is around 98%. Lake Eildons target filling points are available here( you have to scroll down a fair way). Considering the amount that the levels generally increase between July and October the current levels look horribly dangerous to me.
The target filling point for May was 93.1%. This target was achieved, but at this level it appears to be way above any level in the last 60 years as per the GMW website. I just don’t get how this was an acceptable level to aim for.
I presume that the forecast for a dry winter and a possible El Nino forming later in the year, that the Goulburn – Murray Water management (GMW) decided not to have increased outflow early in the year, but I still find that an extremely risky plan considering long range forecasts are only correct approximately 65% of the time.
Now it appears that GMW is stuck between a rock and a hard place unless late winter and spring rainfalls are well below normal.
I repeat I am not a water management expert and I would be more than happy if someone could tell me where I have failed to interpret these figures correctly.
Article by Michael Minter


0 Comments